


Field service dashboards: drive the performance of your technical teams
Service call volume, resolution times, first-time fix rate (FTFR), and profitability:Kolus field service dashboards display your key indicators in real time without Excel reentry.
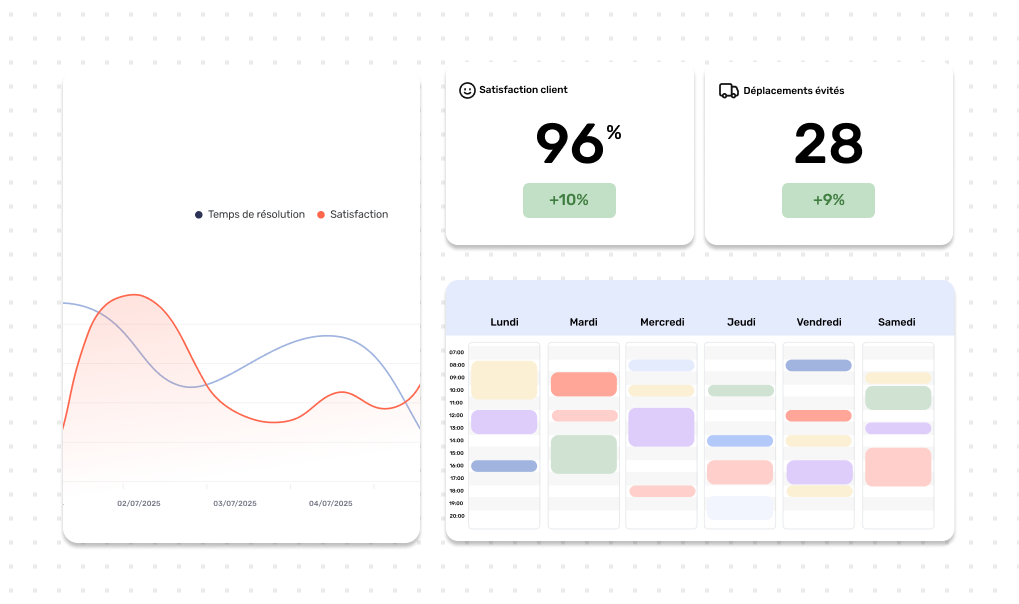
Actionable data for every decision-making level
Designed for field service managers, technical directors, and industrial executives.
⏱️ Response times and SLA compliance
Measure average response and resolution times by equipment type or customer contract, and anticipate delays and penalties.
🎯 First-time fix rate (FTFR)
Track the share of service calls resolved during the first visit and identify the types of failures that require a second trip.
📈 Workload and productivity
Evaluate workload per technician, average travel time, and the precise breakdown between preventive and corrective maintenance calls.
🛢️ Warranty profitability
Measure the actual cost of warranty service calls:allowing you to adjust machine sales prices and maintenance contract offers.
A clear vision tailored to your responsibilities
Every member of the technical service team has access to the metrics that guide their daily actions.
For the field service manager
Balance the daily workload of technicians, track urgent issues live, and anticipate delays to maintain your service rate.
For the technical director
Analyze the reliability of your machine models, identify recurring failures, and enrich your troubleshooting guides based on findings from the field.
For Executive Management
Manage overall field service profitability, control manufacturer warranty costs, and optimize the supply of strategic spare parts.
Identify recurring failures by machine model
Move from reactive field service to continuous improvement of your installed base.
Reliability & Continuous Improvement
- Systematically cross-reference reported failures with machine series to spot recurring defects.
- Complete technical history linked to the serial number of each machine.
- Direct feedback to the engineering department to correct design weaknesses during manufacturing.
Inventory Management & Consumption
- Anticipate spare parts replenishment based on actual wear observed in the field.
- Track the most frequently replaced parts by equipment family and customer.
- Two-way synchronization with your ERP inventory (Sage, SAP, Odoo, etc.).
Metrics fed directly from the field
As soon as a technician validates a work order report or dictates a voice report on mobile, your dashboards are automatically updated. There is no administrative re-entry or Excel file to consolidate at the end of the month.
Frequently asked questions about field service dashboards
Everything you need to know about Kolus management and indicators.
Can data be exported to Excel or Power BI?
Yes. You can export all your data in CSV or Excel format with one click. You can also connect directly to your business intelligence tools (Power BI, Tableau, etc.) via our open REST API.
Are metrics updated in real time?
Yes. As soon as a work order report is signed on a smartphone or a ticket status changes, your dashboards are updated automatically without delay.
Can access be restricted by role?
Yes. You define viewing rights:technicians access their own statistics, while managers and executives get a consolidated view of all operations.
Do the statistics include video assistance?
Yes. You can view the number of video sessions conducted, the remote resolution rate without a dispatch, and the average remote diagnosis time to measure your actual gains.
How are travel and service times measured?
The times come from actual timestamps entered in the mobile app when departing on a route, arriving on-site, and closing the work order report.
Does Kolus allow analysis of manufacturer warranty costs?
Yes. By linking replaced parts and labor to each serial number, you can accurately measure warranty costs to support supplier negotiations or service extension contracts.